Excel Module
Introducing the Excel module
The Excel module is a powerful engine able to create a true XLSX file from any well structured JSON format. Is doesn’t require any software installed on the client machine, so it very well suited for powering web applications, mobile apps and other thin clients. Also a classic fat client can have a huge benefits using the Excel module because it really don’t add any dependancies on the (already “fat”) client side.
Excel Module Main Features
- Allows to generate true Excel xlsx files starting from a JSON data structure
- Supports formatting, formulas and sparkline graphs
- Supports generation of multiple worksheets in a single workbook
- Really fast, even to generate big Excel files
- Doesn’t require MS Excel nor on the client nor on the server
Required Roles
- report
Predefined User
DMSContainer provides a predefined user to handle reports. It is on “disabled” state as default:
- user_report: it can create reports. Default password “pwd1”;
Sample JSON Structure for Excel Module
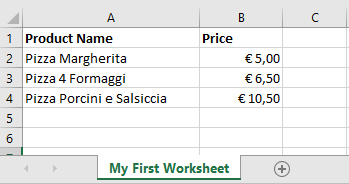
The JSON string sent to the service is quite simple and fully describe a list of worksheets. The following example shows a JSON which describe a simple worksheet with:
- 2 columns (“Product Name” and “Price”)
- “Product Name” is of type “general” (no special formatting assigned, just text)
- “Price” is of type “number” and is formatted using mask “€ #,##0.00”
- Contains 3 rows
{
  "worksheets": [{
	"name": "My First Worksheet",
	"columns": [
		    {"title": "Product Name",  "type": "general"},
		    {"title": "Price", "type": "number", "format": "€ #,##0.00"}
            ],
	"data": [
            ["Pizza Margherita", 5.00],
			      ["Pizza 4 Formaggi", 6.50],
		   	    ["Pizza Porcini e Salsiccia", 10.50]
		      ]
  }]
}
This JSON generates the following Excel workbook
To generate more worksheets, just add more nodes to the JSON. The following JSON will generates 2 worksheets with the same data.
{
  "worksheets": [{
	"name": "My First Worksheet",
	"columns":  [
		            {"title": "Product Name",  "type": "general"},
		            {"title": "Price", "type": "number", "format": "€ #,##0.00"}
              ],
	"data": [
            ["Pizza Margherita", 5.00],
			      ["Pizza 4 Formaggi", 6.50],
		   	    ["Pizza Porcini e Salsiccia", 10.50]
		      ]
  },
  {
	  "name": "My Second Worksheet",
	  "columns":  [
		            {"title": "Product Name",  "type": "general"},
		            {"title": "Price", "type": "number", "format": "€ #,##0.00"}
                ],
	"data": [
            ["Pizza Margherita", 5.00],
	          ["Pizza 4 Formaggi", 6.50],
		        ["Pizza Porcini e Salsiccia", 10.50]
		      ]
    }
  ]
}
Example Source Code
procedure TMainForm.OnValidateCert(const Sender: TObject; const ARequest: TURLRequest; const Certificate: TCertificate;
  var Accepted: Boolean);
begin
  {check your certificate if you want - in this case we accept it blindly}
  Accepted := true;
end;

procedure TMainForm.btnRawJSONClick(Sender: TObject);
var
  lJResp: TJSONObject;
  lOutputFileName: string;
  lJSONData: TJSONObject;
  lToken: string;
  lProxy: TExcelRPCProxy;
const
  JSON =
    '{ ' +
    '  "worksheets": [{' +
    '	"name": "My First Worksheet",' +
    '	"columns": [' +
    '		    {"title": "Product Name",  "type": "general"},' +
    '		    {"title": "Price", "type": "number", "format": "€ #,##0.00"}' +
    '            ],' +
    '	"data": [' +
    '                 ["Pizza Margherita", 5.00],' +
    '                 ["Pizza 4 Formaggi", 6.50],' +
    '                 ["Pizza Porcini e Salsiccia", 10.50]' +
    '		    ]' +
    '}]}';
begin
  lProxy := TExcelRPCProxy.Create(GetEndPoint);
  try
    lProxy.RPCExecutor.SetOnValidateServerCertificate(OnValidateCert);
    lJResp := fProxy.Login('user_sender', 'pwd1');
    try
      lToken := lJResp.S['token'];
    finally
      lJResp.Free;
    end;
    lOutputFileName := 'raw_json.xlsx';
    lJSONData := TJSONObject.Parse(JSON) as TJSONObject;
    lJResp := lProxy.ConvertToXLSX(lToken, lJSONData);
    try
      { Base64StringToFile is declared in MVCFramework.Commons.pas }
      Base64StringToFile(lJResp.S['xlsx'], lOutputFileName);
    finally
      lJResp.Free;
    end;
  finally
    lProxy.Free;
  end;
  ShellExecute(0, PChar('open'), PChar(lOutputFileName), nil, nil, SW_SHOW);
end;
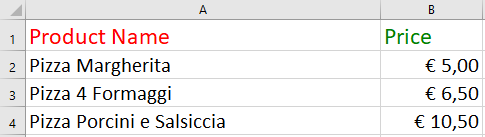
Using custom formatting
Each column and each header can have a custom formatting. The column object can define “header_options” to customize the aspect of an header and “options” to customize the aspect of the column data cells. Here’s an example.
    {
      "worksheets": [{
    	"name": "My Very Fancy Worksheet",
    	"columns": [
    		    {"title": "Product Name", "type": "general", "width": 100,
                        "header_options": {"font_color":"red", "font_size": 18},
                        "options":{"font_size": 16}
                },
    		    {"title": "Price", "type": "number", "format": "€ #,##0.00",
                        "header_options": {"font_color":"green", "font_size": 18},
                        "options":{"font_size": 16}
                }
            ],
    	"data": [
                    ["Pizza Margherita", 5.00],
                    ["Pizza 4 Formaggi", 6.50],
                    ["Pizza Porcini e Salsiccia", 10.50]
                ]
    }]}
And this is the generated Excel sheet.
Formatting properties for headers and cells
The following table shows the Excel formatting properties that can be applied in the object “header_options” and “options”:
| Description | Property | Description |
|---|---|---|
| Font type | ‘font_name’ | Set the font used in the cell (string) |
| Font size | ‘font_size’ | Set the size of the font used in the cell (int) |
| Font color | ‘font_color’ | Set the color of the font used in the cell (string). The color can be a Html style #RRGGBB string or a named color as explained in the next section (e.g. ‘red’, ‘green’, ‘white’) |
| Bold | ‘bold’ | Turn on bold for the format font (bool) |
| Italic | ‘italic’ | Turn on italic for the format font (bool) |
| Underline | ‘underline’ | Turn on underline for the format (bool) |
| Strikeout | ‘font_strikeout’ | Set the strikeout property of the font (bool) |
| Super/Subscript | ‘font_script’ | Set the superscript/subscript property of the font (int, can be 1 for superscript or 2 for subscript) |
| Numeric format | ‘num_format’ | Set the number format for a cell (string) |
| Lock cells | ‘locked’ | Set the cell locked state (bool) |
| Hide formulas | ‘hidden’ | Hide formulas in a cell (bool) |
| Horizontal align | ‘align’ | Set the horizontal alignment for data in the cell (string, can be left, center, right, fill, justify, center_across, distributed) |
| Vertical align | ‘valign’ | Set the vertical alignment for data in the cell (string, can be top, vcenter, bottom, vjustify, vdistributed) |
| Rotation | ‘rotation’ | Set the rotation of the text in a cell (int, Rotation angle in the range -90 to 90 and 270) |
| Text wrap | ‘text_wrap’ | Wrap text in a cell (bool). Turn text wrapping on for text in a cell |
| Reading order | ‘reading_order’ | Set the reading order for the text in a cell. |
| Justify last | ‘text_justlast’ | Turn on the justify last text property (bool) |
| Center across | ‘center_across’ | Center text across adjacent cells (bool) |
| Indentation | ‘indent’ | Set the cell text indentation level (int) |
| Shrink to fit | ‘shrink’ | Turn on the text “shrink to fit” for a cell (bool) |
| Cell pattern | ‘pattern’ | Pattern index (0 - 18). Set the background pattern of a cell. The most common pattern is 1 which is a solid fill of the background color. |
| Background color | ‘bg_color’ | Set the color of the background pattern in a cell. The color can be a Html style #RRGGBB string or a named color as explained in the next section (e.g. ‘red’, ‘green’, ‘white’) |
| Foreground color | ‘fg_color’ | Set the color of the foreground pattern in a cell. The color can be a Html style #RRGGBB string or a named color as explained in the next section (e.g. ‘red’, ‘green’, ‘white’) |
| Cell border | ‘border’ | Set the cell border style. Parameters: style (int, 0-13) – Border style index. Default is 1. |
| Bottom border | ‘bottom’ | Set the cell bottom border style. |
| Top border | ‘top’ | Set the cell top border style. |
| Left border | ‘left’ | Set the cell left border style. |
| Right border | ‘right’ | Set the cell right border style. |
| Border color | ‘border_color’ | Set the color of the cell border. |
| Bottom color | ‘bottom_color’ | Set the color of the bottom cell border. |
| Top color | ‘top_color’ | Set the color of the top cell border. |
| Left color | ‘left_color’ | Set the color of the left cell border. |
| Right color | ‘right_color’ | Set the color of the right cell border. |
Named colors and their RGB color value
| Color name | RGB color value |
|---|---|
| black | #000000 |
| blue | #0000FF |
| brown | #800000 |
| cyan | #00FFFF |
| gray | #808080 |
| green | #008000 |
| lime | #00FF00 |
| magenta | #FF00FF |
| navy | #000080 |
| orange | #FF6600 |
| pink | #FF00FF |
| purple | #800080 |
| red | #FF0000 |
| silver | #C0C0C0 |
| white | #FFFFFF |
| yellow | #FFFF00 |
Border types
A cell border is comprised of a border on the bottom, top, left and right. These can be set to the same value using property ‘border’ or individually using the relevant properties shown above.
The following shows the border styles using their index number:
| Index | Name | Weight |
|---|---|---|
| 0 | None | 0 |
| 1 | Continuous | 1 |
| 2 | Continuous | 2 |
| 3 | Dash | 1 |
| 4 | Dot | 1 |
| 5 | Continuous | 3 |
| 6 | Double | 3 |
| 7 | Continuous | 0 |
| 8 | Dash | 2 |
| 9 | Dash Dot | 1 |
| 10 | Dash Dot | 2 |
| 11 | Dash Dot Dot | 1 |
| 12 | Dash Dot Dot | 2 |
| 13 | SlantDash Dot | 2 |
Using Formulas
In general a formula in Excel can be used directly in the cell using the “=” notation:
[1,2,3, "=5*A1+C1"]
Excel functions and separator/range operator
Excel stores formulas in the format of the US English version, regardless of the language or locale of the end-user’s version of Excel. Therefore all formula function names written in the JSON document must be in English:
"=SUM(1, 2, 3)"    # OK
"=SOMMA(1, 2, 3)"  # Italian. Error on load.
"=SOMME(1, 2, 3)"  # French. Error on load.
Also, formulas must be written with the US style separator/range operator which is a comma (not semi-colon). Therefore a formula with multiple values should be written as follows:
"=SUM(1, 2, 3)"   # OK
"=SUM(1; 2; 3)"   # Error! Semi-colon. Error on load.
Using Sparkline
A sparkline is a very small line chart, typically drawn without axes or coordinates. It presents the general shape of the variation (typically over time) in some measurement, such as temperature or stock market price, in a simple and highly condensed way. Sparklines are small enough to be embedded in text, or several sparklines may be grouped together as elements of a small multiple. Whereas the typical chart is designed to show as much data as possible, and is set off from the flow of text, sparklines are intended to be succinct, memorable, and located where they are discussed. DMSContainer supports sparkline cells and allows to generate Excel sheets like the following.
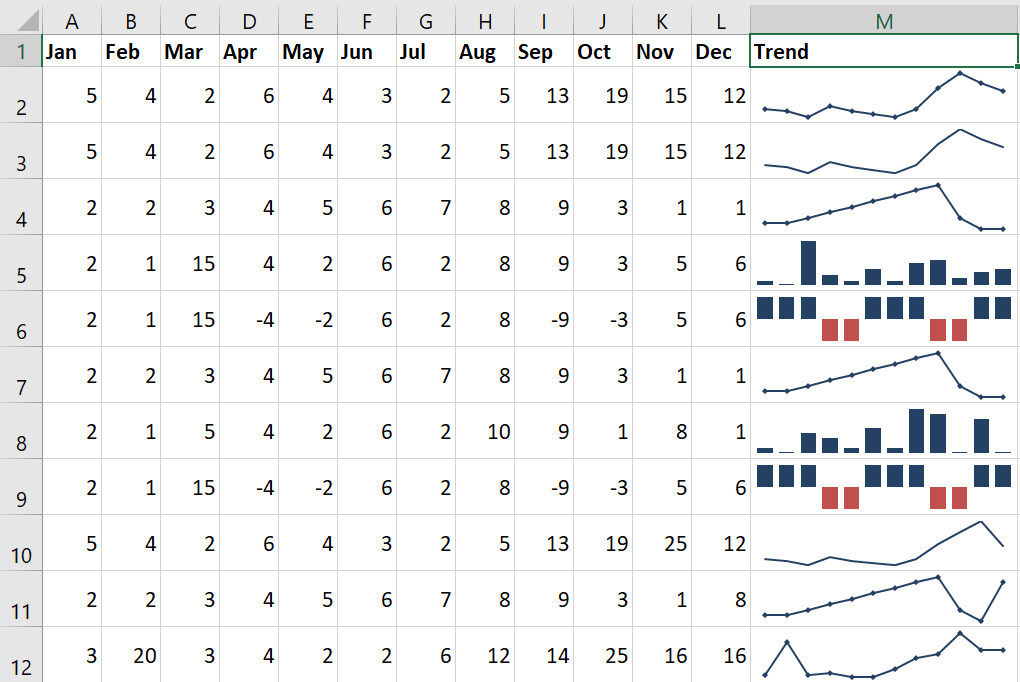
This sheet has been generated by the following JSON structure.
    {
      "worksheets": [{
    	"name": "My First Worksheet",
    	"columns": [
    		    {"title": "Jan",  "type": "number", "width": 10},
    		    {"title": "Feb",  "type": "number", "width": 10},
    		    {"title": "Mar",  "type": "number", "width": 10},
    		    {"title": "Apr",  "type": "number", "width": 10},
    		    {"title": "May",  "type": "number", "width": 10},
    		    {"title": "Jun",  "type": "number", "width": 10},
    		    {"title": "Jul",  "type": "number", "width": 10},
    		    {"title": "Aug",  "type": "number", "width": 10},
    		    {"title": "Sep",  "type": "number", "width": 10},
    		    {"title": "Oct",  "type": "number", "width": 10},
    		    {"title": "Nov",  "type": "number", "width": 10},
    		    {"title": "Dec",  "type": "number", "width": 10},
    		    {"title": "Trend","type": "sparkline", "width": 15}
                ],
    	"data": [
                 [5,4,2,6,4,3,2,5,13,19,15,12, {"range":"A2:L2","markers": true}],
                 [5,4,2,6,4,3,2,5,13,19,15,12, {"range":"A3:L3","markers": false}],
                 [2,2,3,4,5,6,7,8,9,3,1,1, {"range":"A4:L4","markers": true}],
                 [2,1,15,4,2,6,2,8,9,3,5,6, {"range":"A5:L5","type":"column"}],
                 [2,1,15,-4,-2,6,2,8,-9,-3,5,6, {"range":"A6:L6","type":"win_loss", "negative_points":true}],
                 [2,2,3,4,5,6,7,8,9,3,1,1, {"range":"A7:L7","markers": true}],
                 [2,1,5,4,2,6,2,10,9,1,8,1, {"range":"A8:L8","type":"column"}],
                 [2,1,15,-4,-2,6,2,8,-9,-3,5,6, {"range":"A9:L9","type":"win_loss", "negative_points":true}],
                 [5,4,2,6,4,3,2,5,13,19,25,12, {"range":"A10:L10","markers": false}],
                 [2,2,3,4,5,6,7,8,9,3,1,8, {"range":"A11:L11","markers": true}],
                 [3,20,3,4,2,2,6,12,14,25,16,16, {"range":"A12:L12","markers": true}]
    		    ]
    }]}
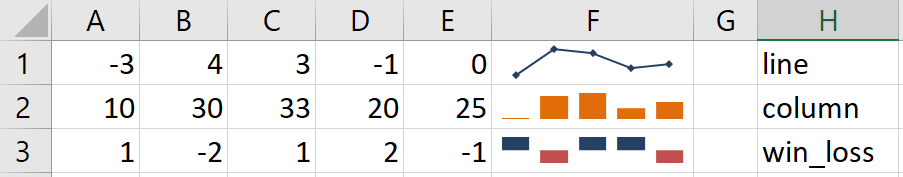
The Excel Module support 3 types of sparkline: line (default), column and win_loss. The following image shows the all the available types.
Full example
Full example code with all the features explained are available in the official samples provided.